User Analysis
This is used to check the stay area and movement distance per worker.
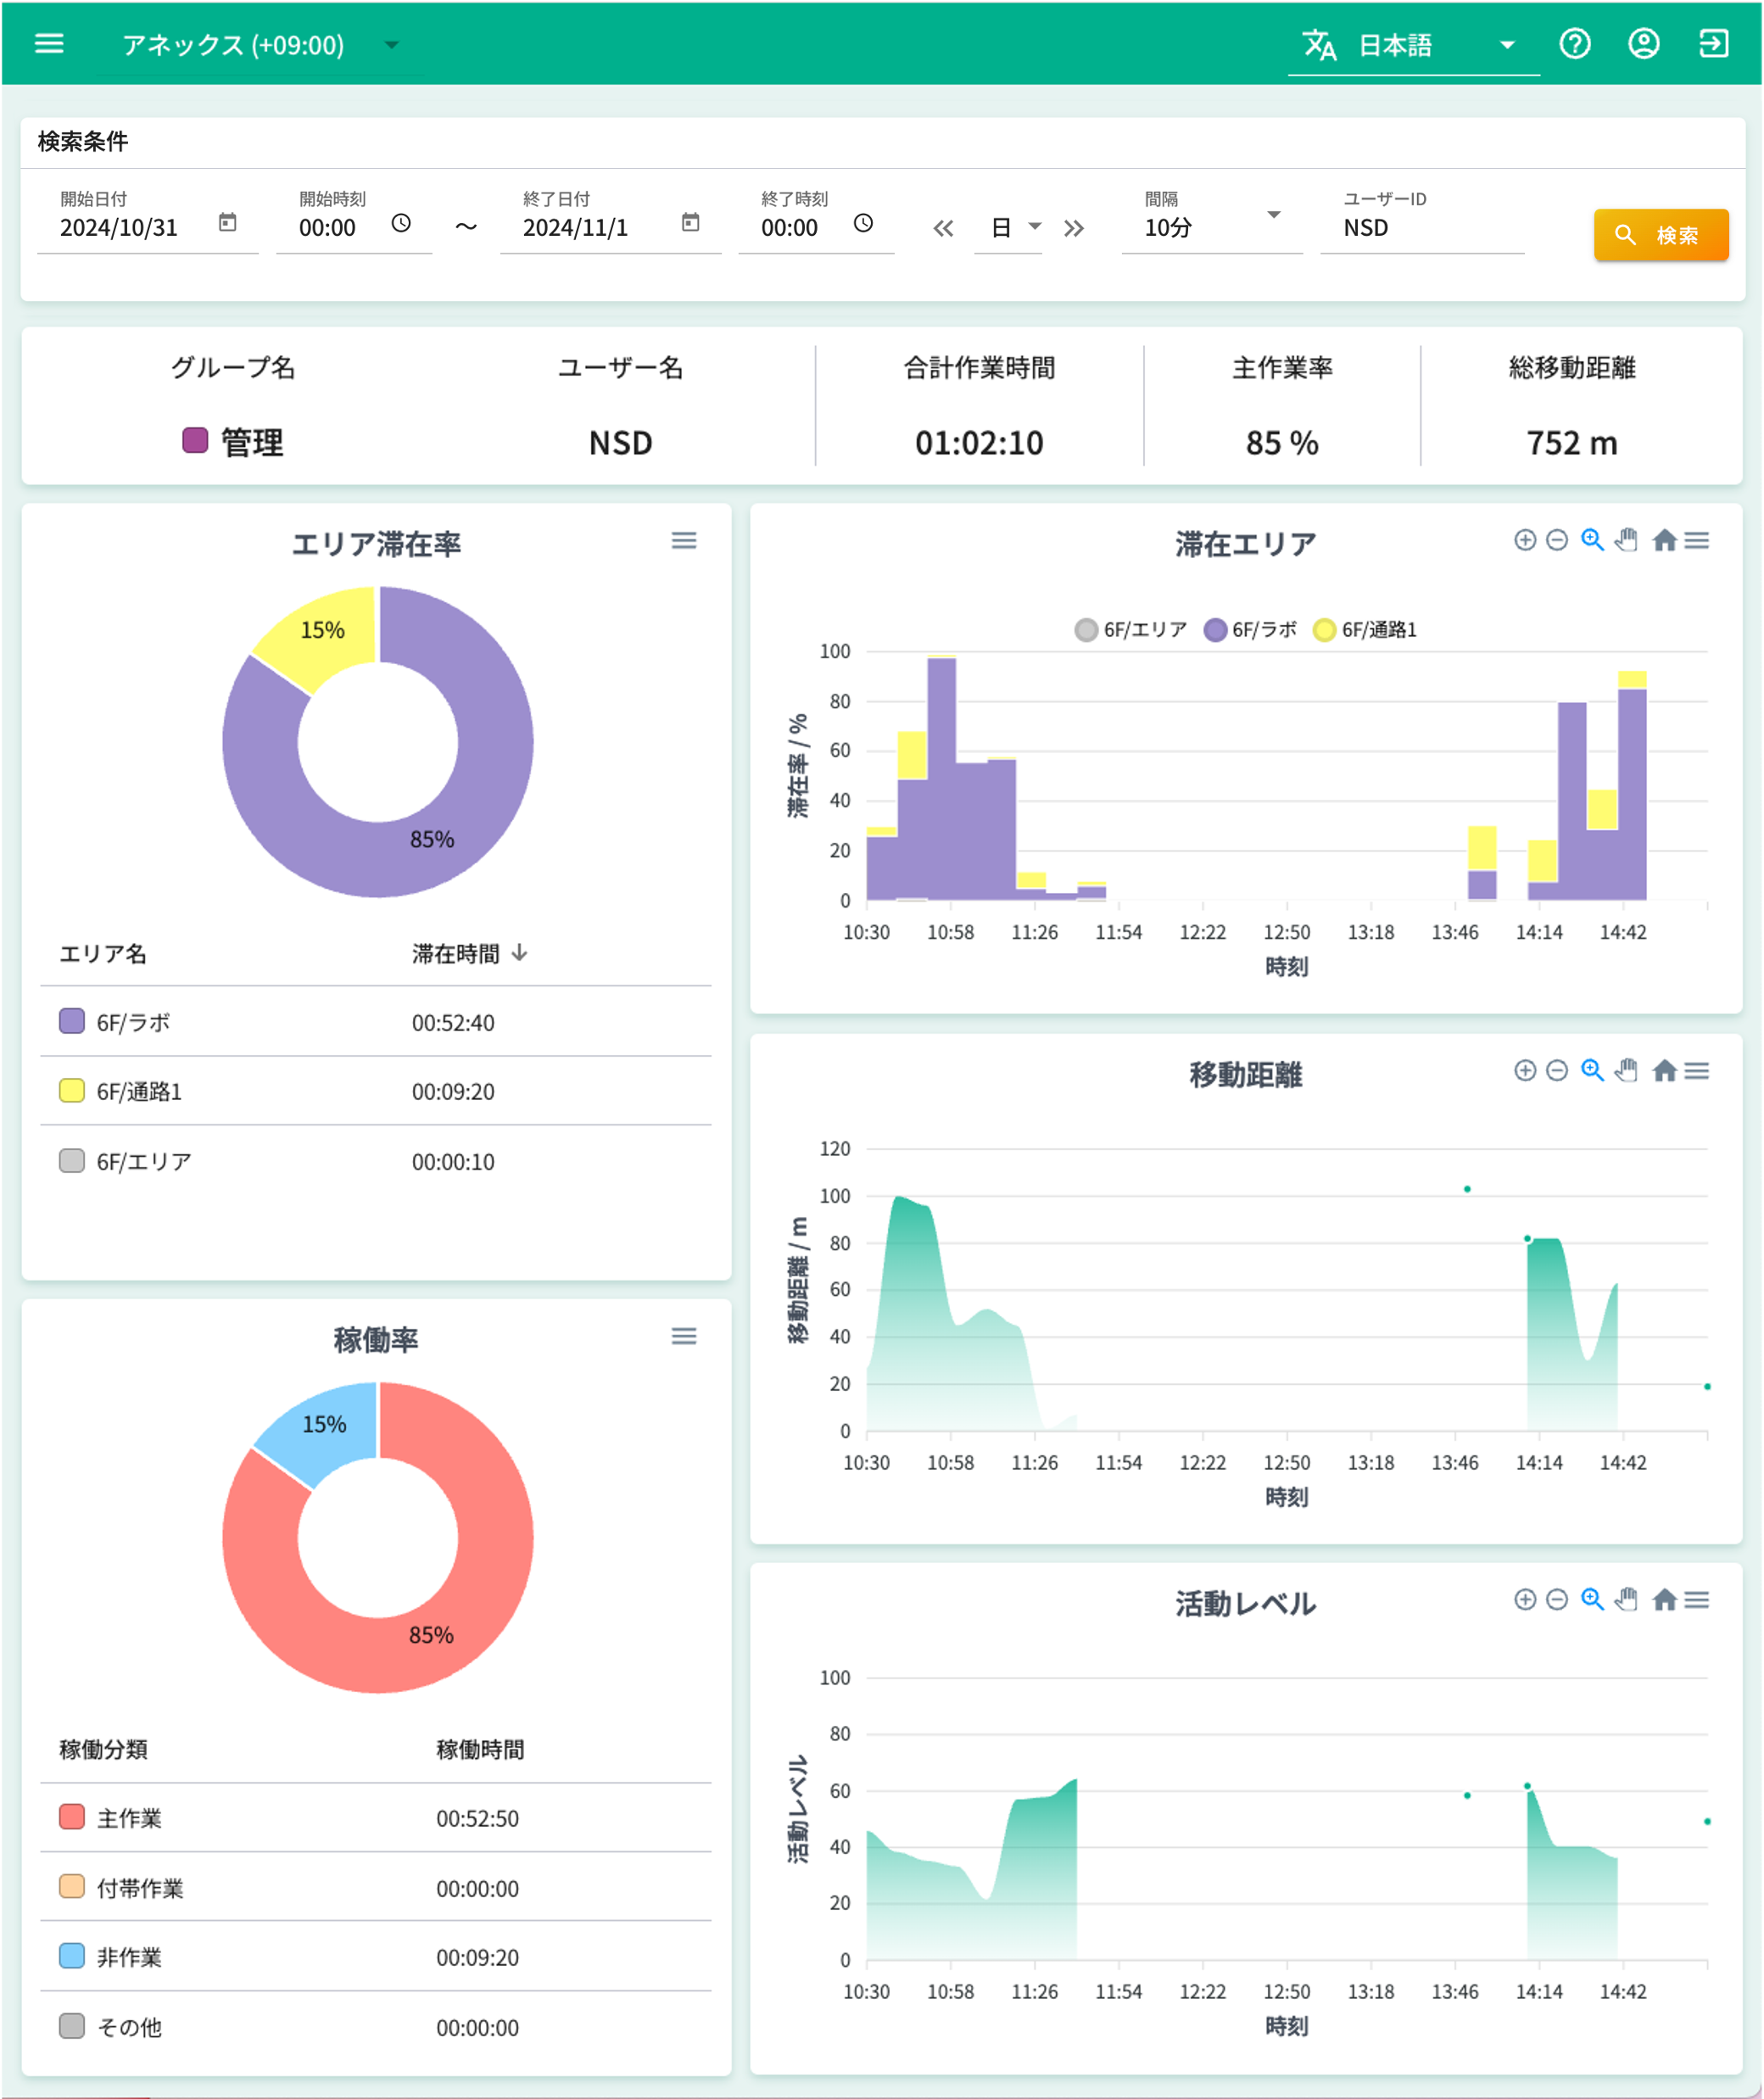
Search Conditions
Enter the date and time, aggregation interval, and user ID you want to view the data for, and click the search button.
If the portal user and the base have different time zones, please set the date based on the base's date as the search condition.
Aggregation Results
Overview
User information and key indicators such as total time are displayed.
Area Stay Rate
The cumulative stay time for each area is displayed.
You can check the ratio in a pie chart and the breakdown in a table format.
Operation Rate
The ratio of work classifications set for each area is displayed.
You can check the ratio in a pie chart and the breakdown in a table format.
You can set which work classification to assign to each area on the layout screen.
Stay Area
The ratio of areas stayed in by time period is displayed.
(Example) If the interval is 10 minutes, and Area A is 60% and Area B is 40%, it means:
- 6 minutes in Area A
- 4 minutes in Area B
Movement Distance
The movement distance by time period is displayed.
The output value is the total value.
(Example) If the interval is 10 minutes, the total movement distance for 10 minutes is displayed.
Activity Level
The activity level (how actively you were moving) by time period is displayed.
The output value is the average value.
(Example) If the interval is 10 minutes, the average activity level for 10 minutes is displayed.