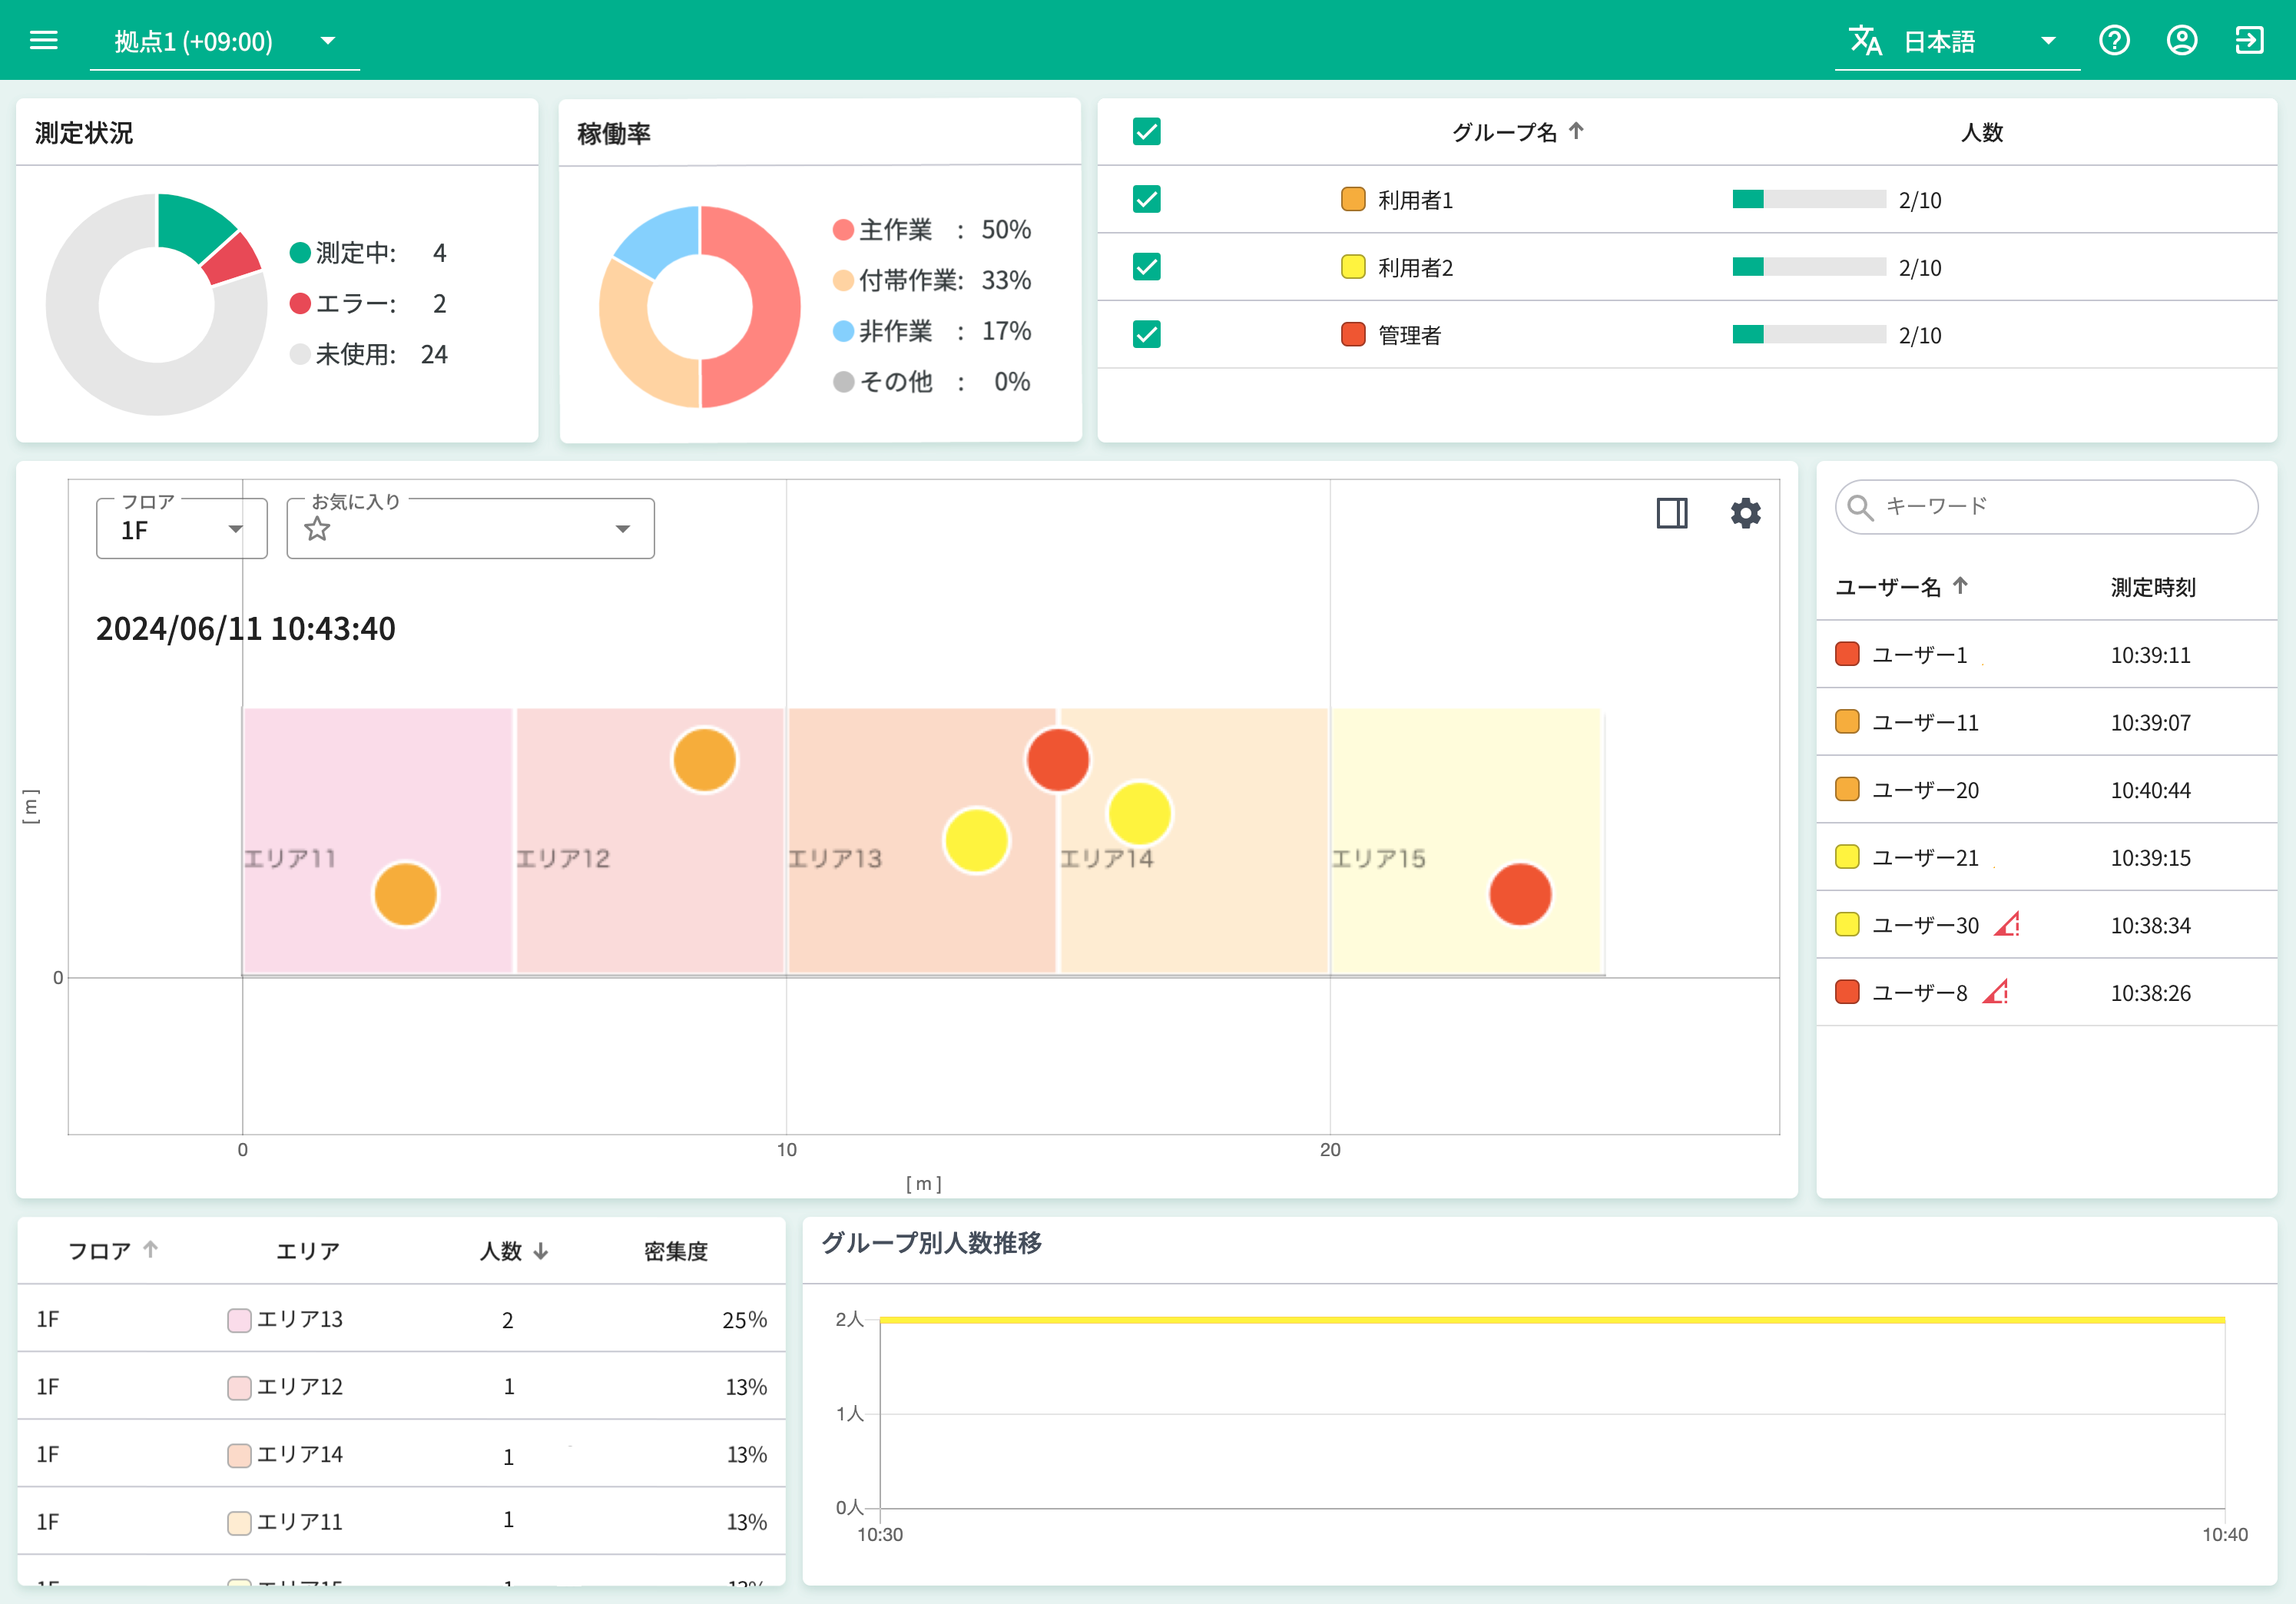
Real-time
The current location of the worker being measured is displayed. The display target is only users in the group that the logged-in user has reference authority.
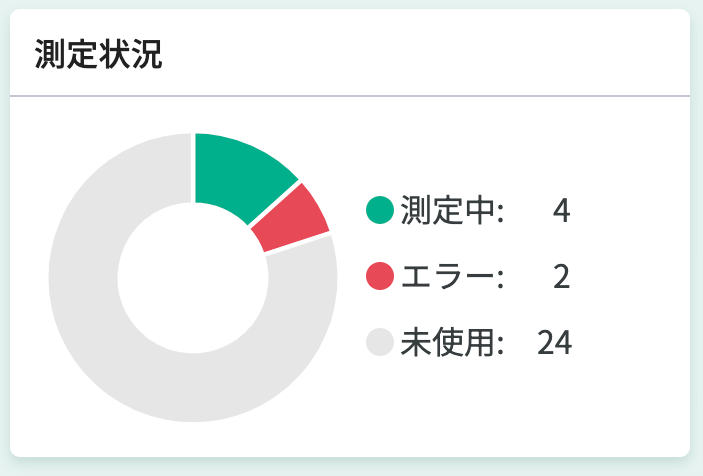
Operating Status
The number of active devices and the number of devices that failed to send data are displayed for the registered number of devices.
Operating Rate
The percentage of time the target user was engaged in "main work, auxiliary work, non-work" is displayed. (If each work classification is less than 2%, the % display is omitted.)
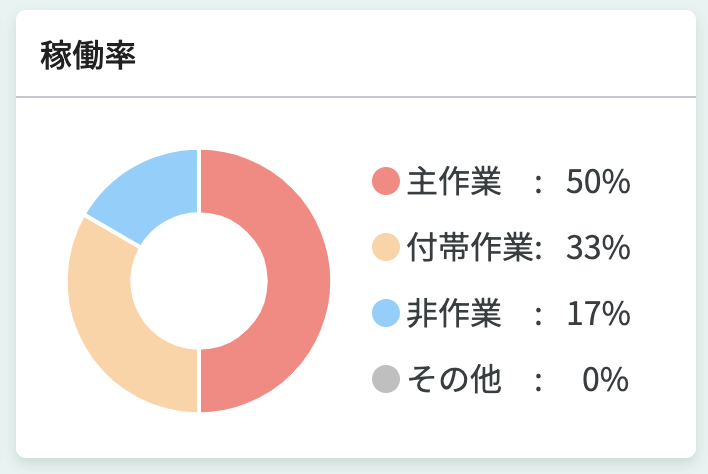
- The graph is updated every 10 minutes.
- Areas where work classification is not registered are displayed as "Others".
- To display the operating rate, it is necessary to set the work classification for each area on the layout screen.
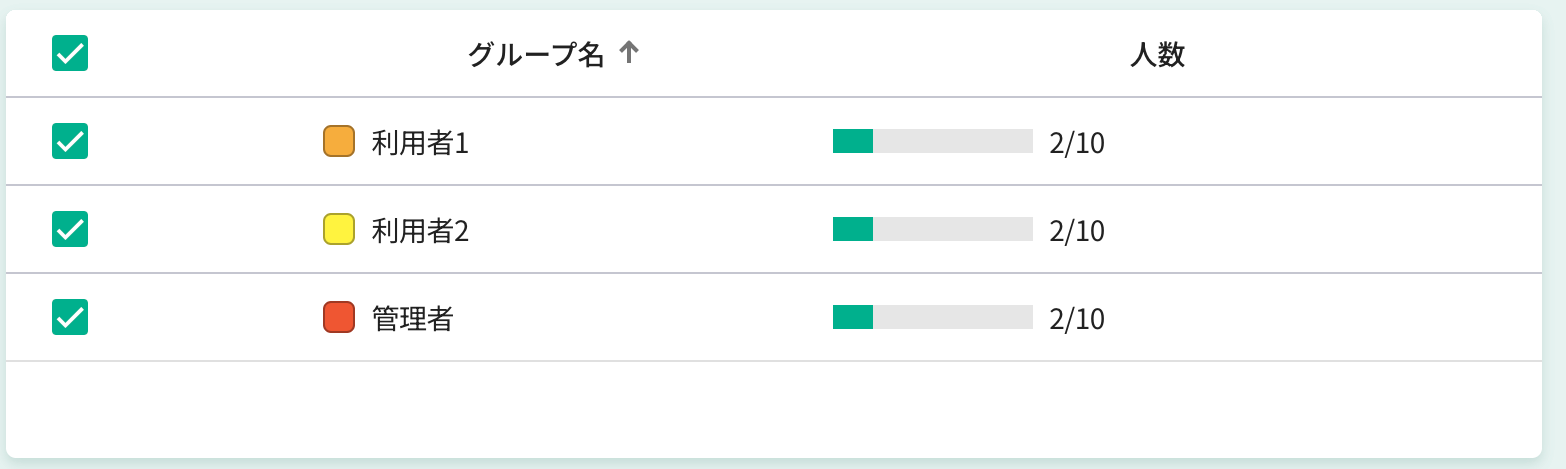
Group List
A list of [Group Name] [Number of People] in the group is displayed. The number of people being measured is displayed against the number of people belonging to the group. Information of groups with checks is displayed on the map and user list.
Map
The location information of users staying in the [Measurement Area] is displayed. You can check the [ID] by hovering the cursor over the user displayed on the map.
Favorites can be registered at any location on the map. By registering favorites, you can quickly navigate to the desired location even if there are multiple areas.
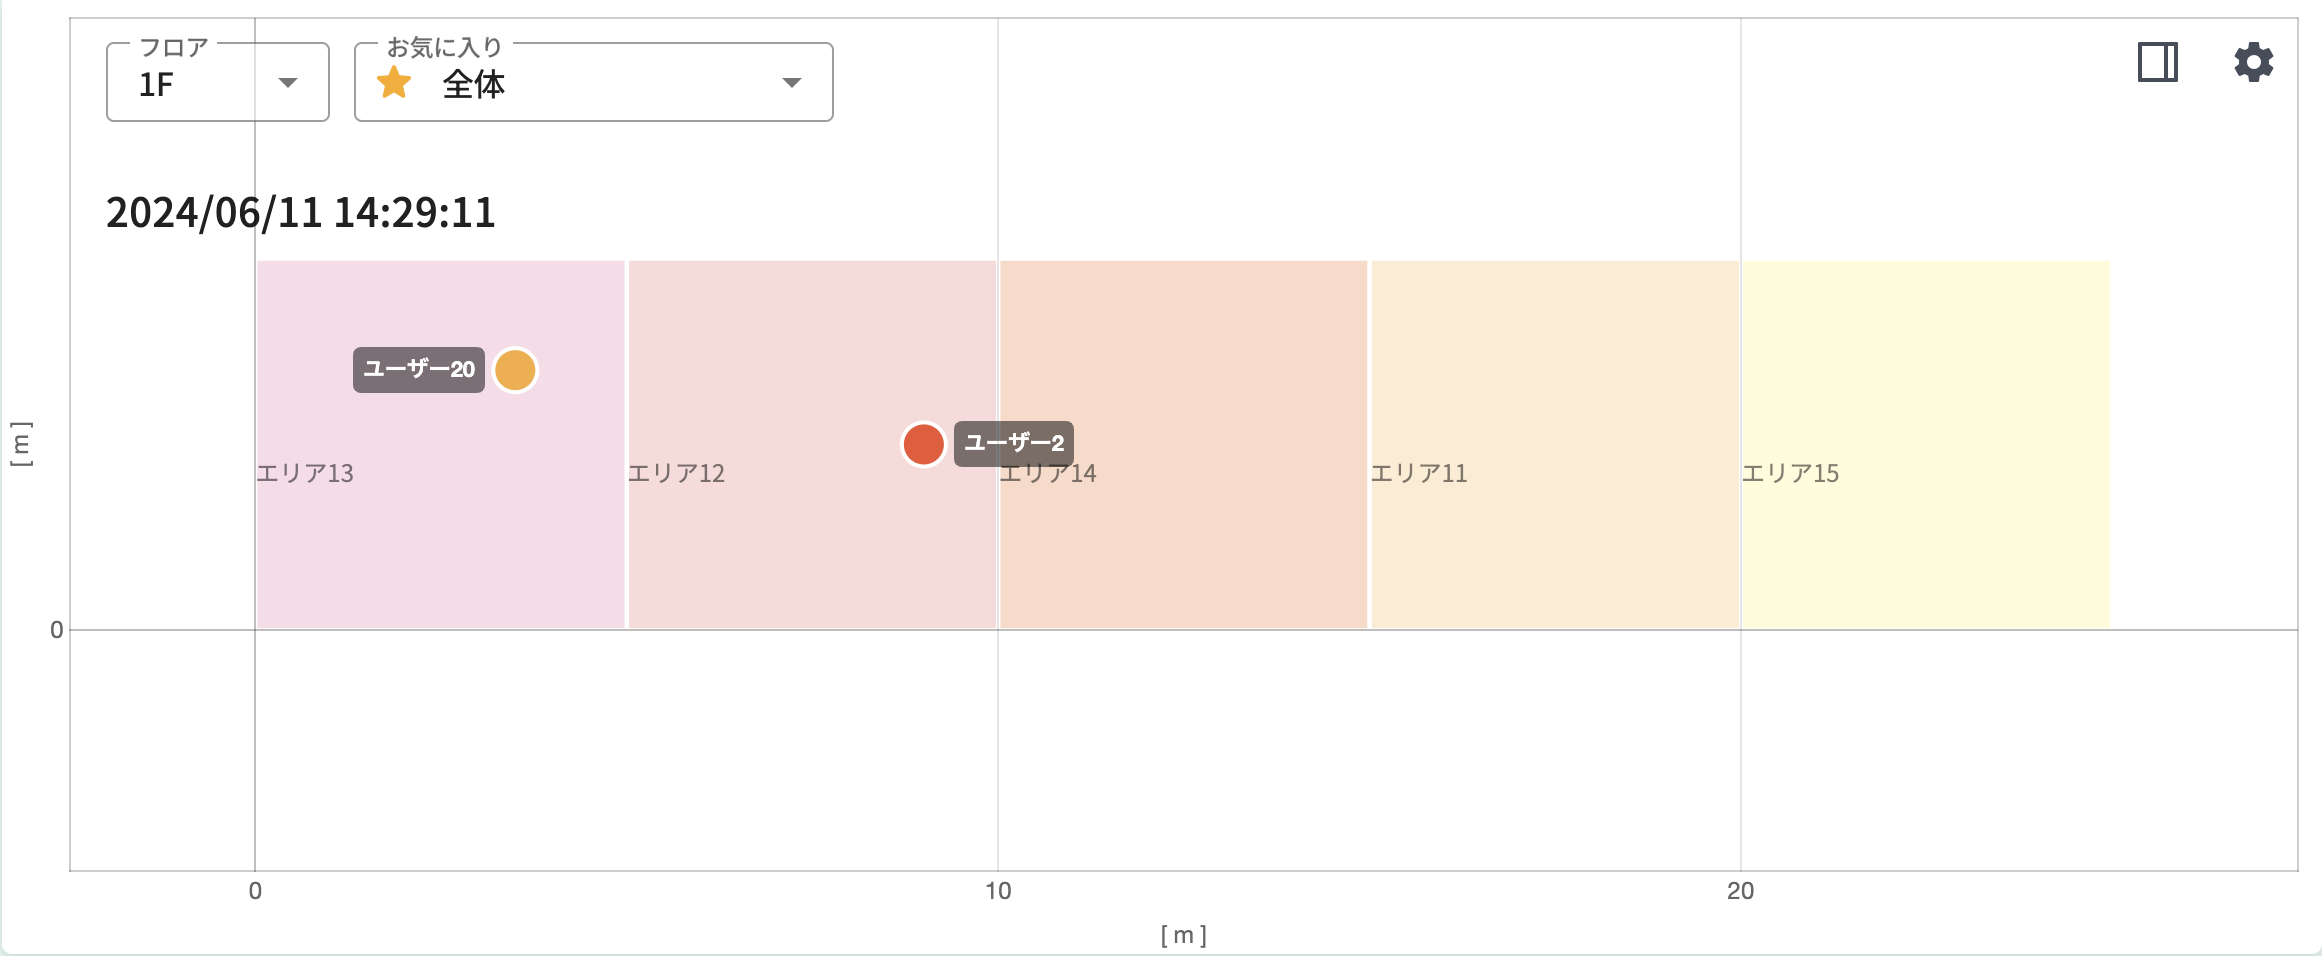
The displayed time is the current time according to the base time zone.
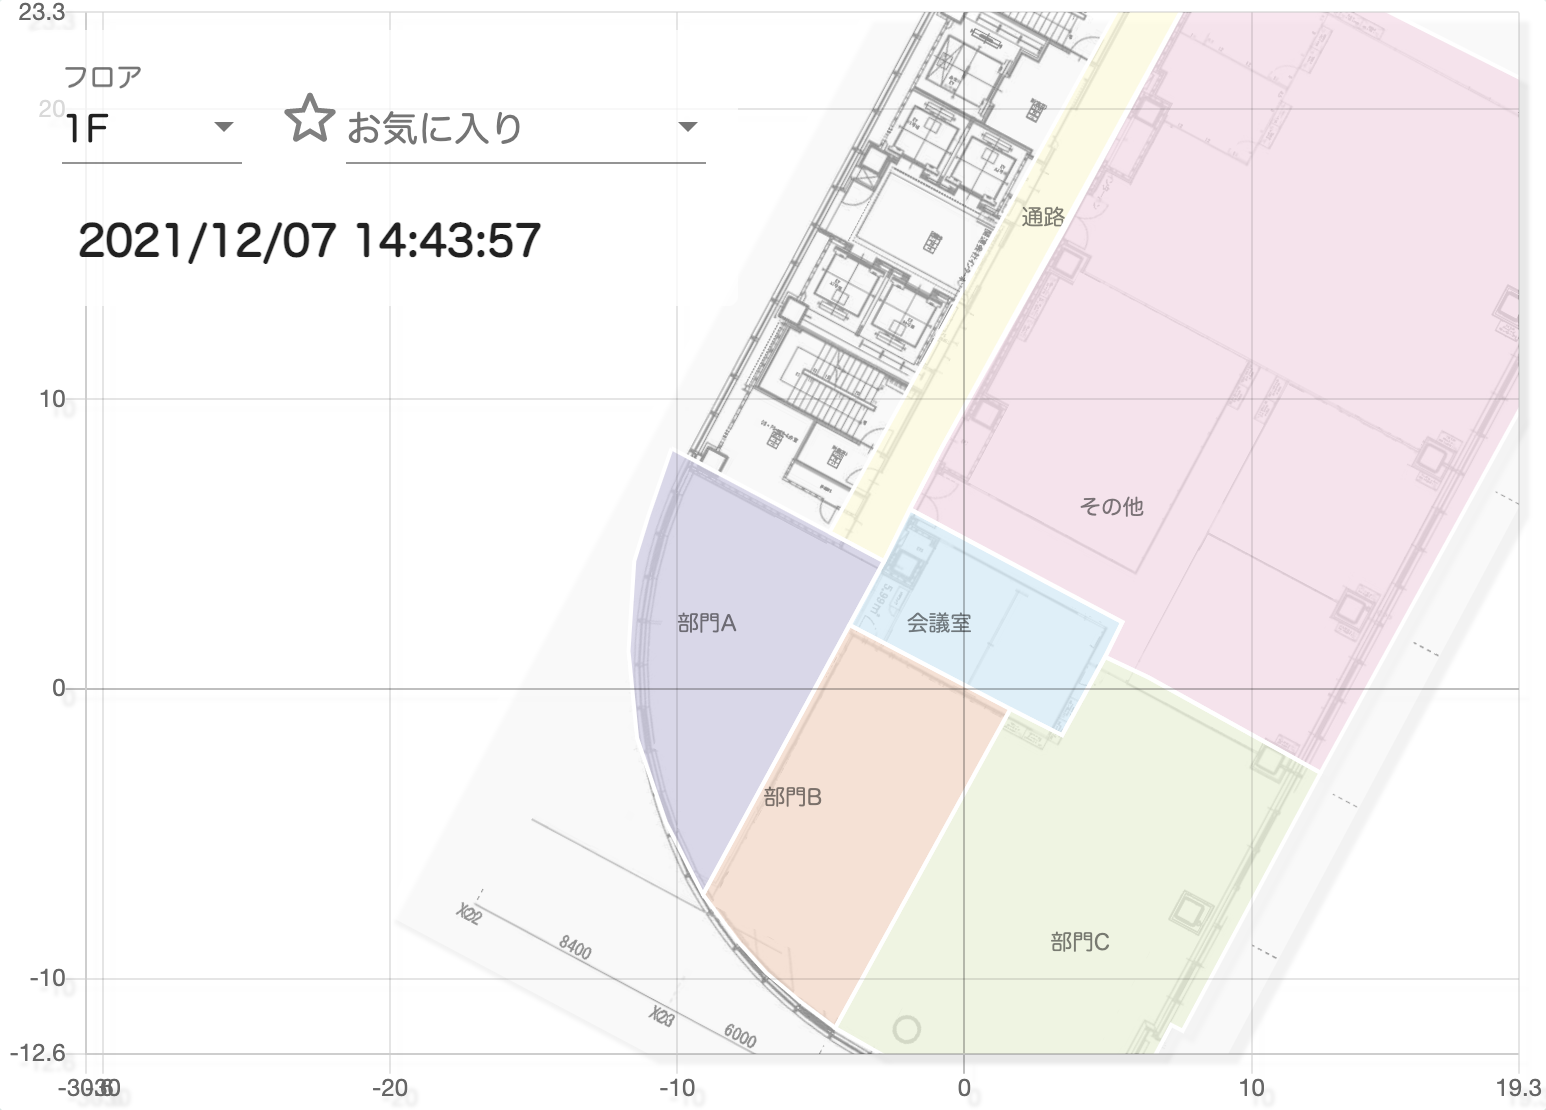
Drawing Display
Drawings are also displayed when set in the layout.
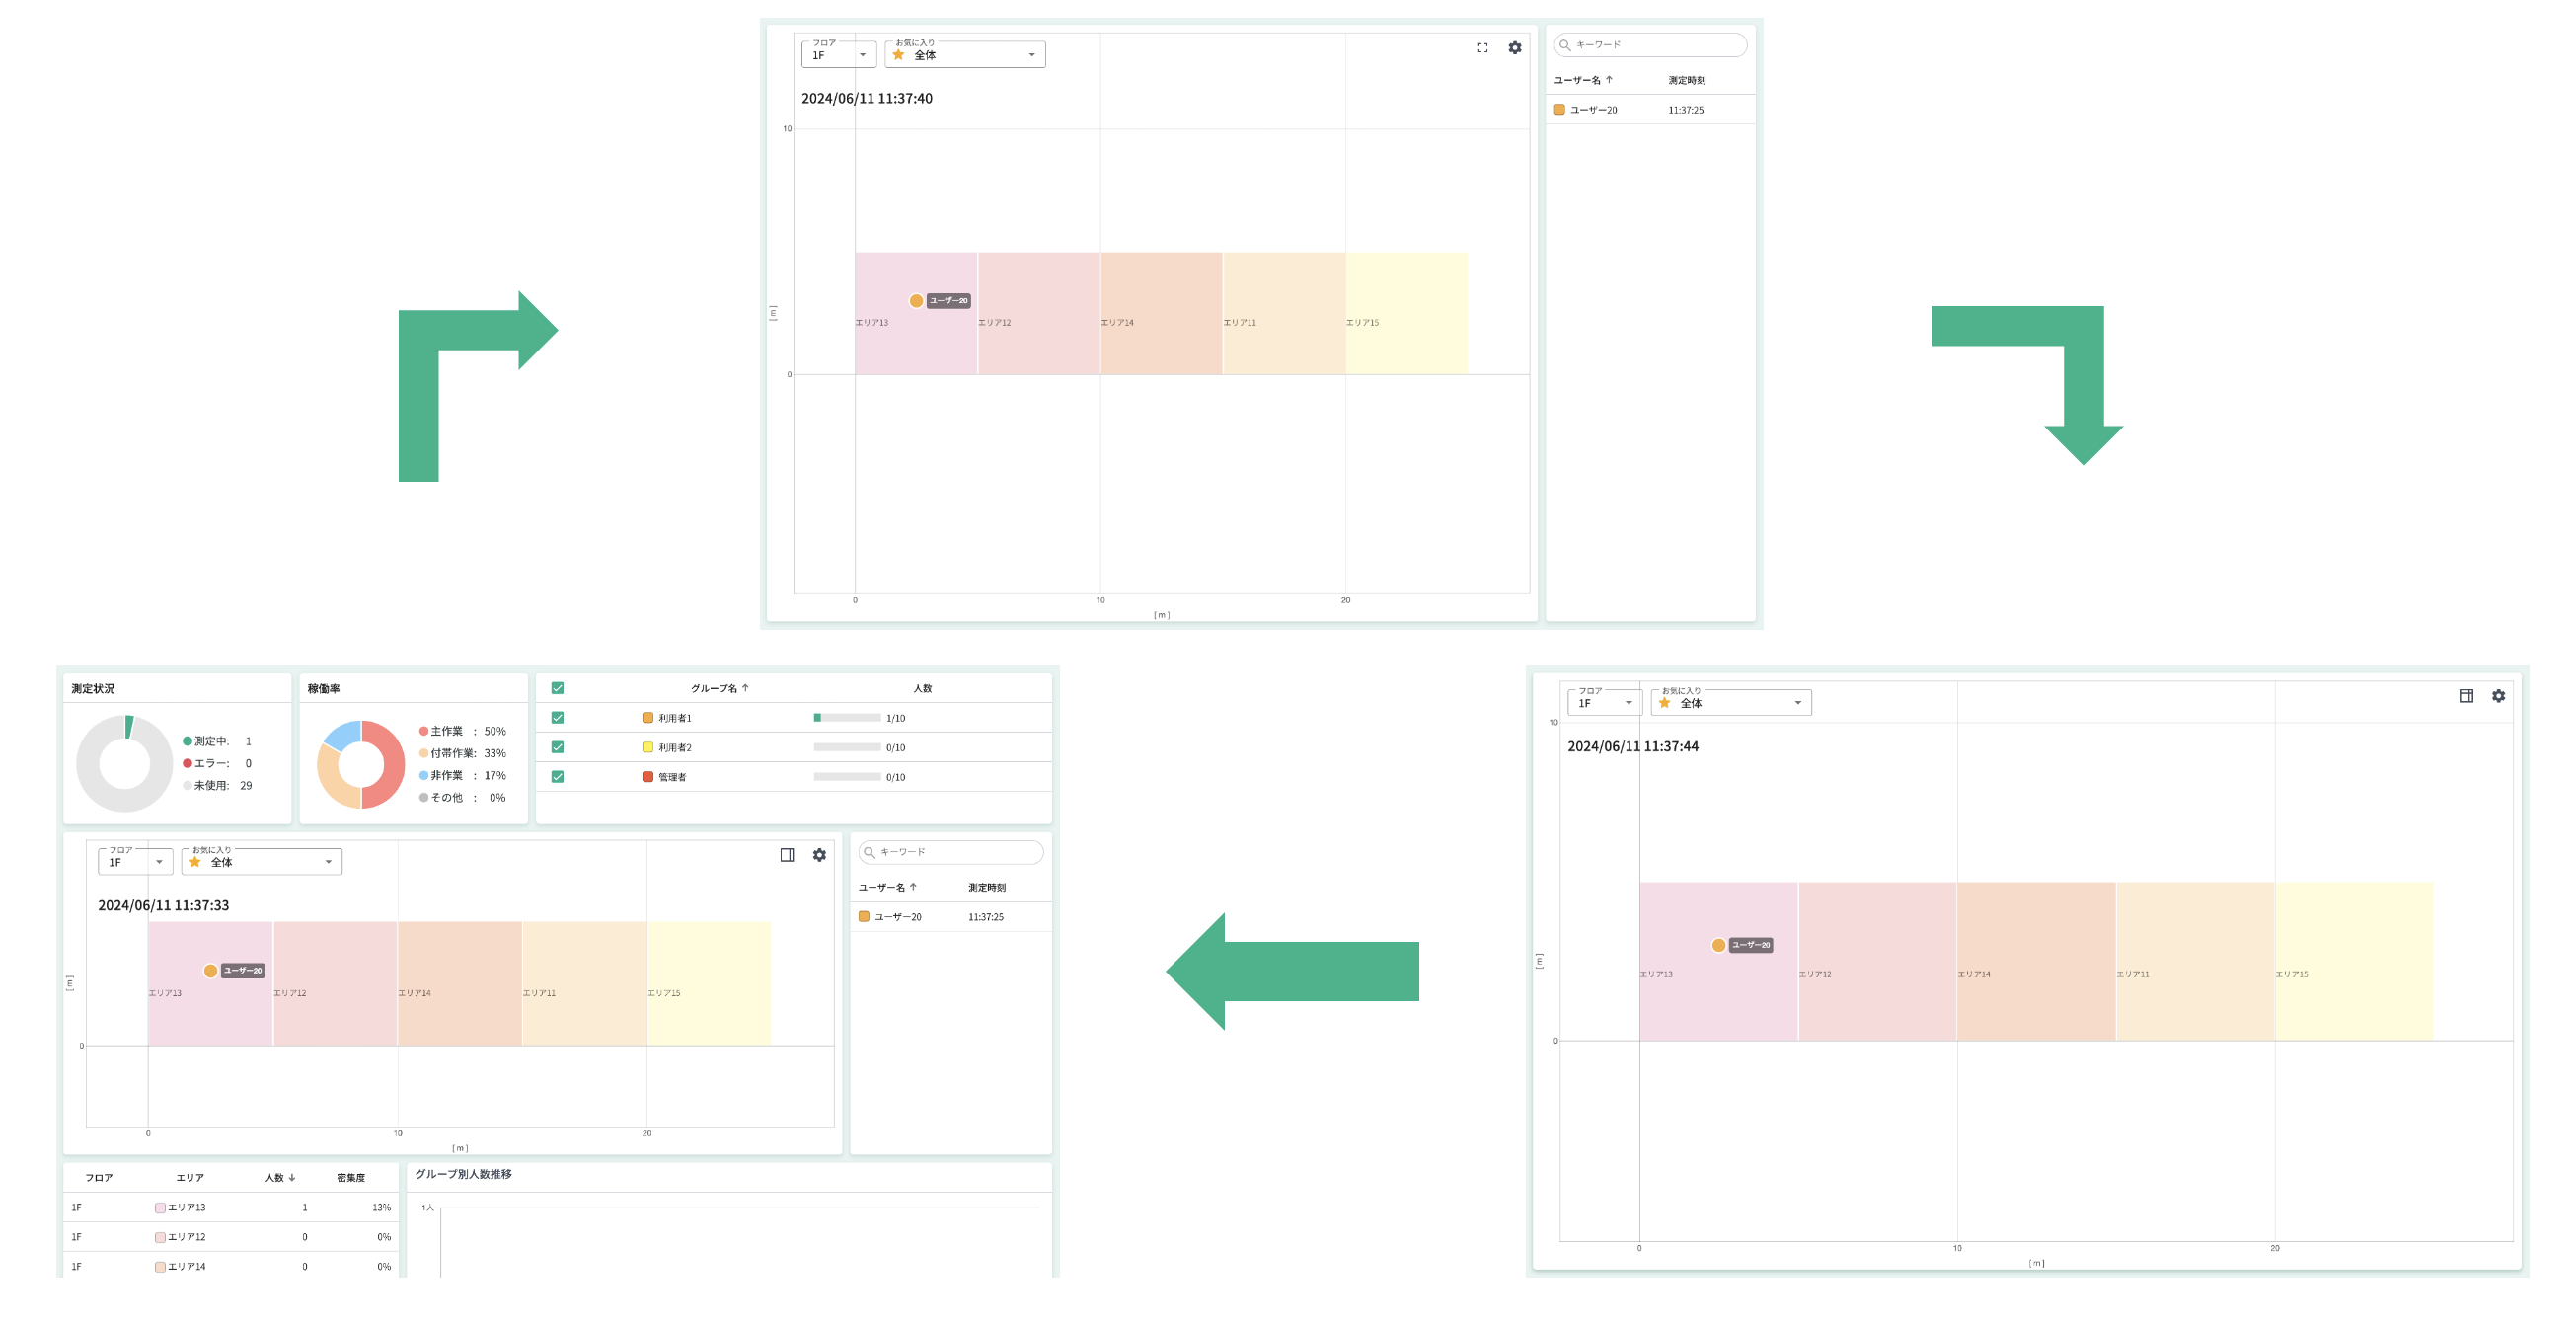
Screen Display
You can select the type of screen you want to display. You can change to three types from the panel display icon in the map.
User List
A list of [User Name] [Measurement Time] of users is displayed. Users with errors have a ⚠︎ mark on the right side of the measurement time.
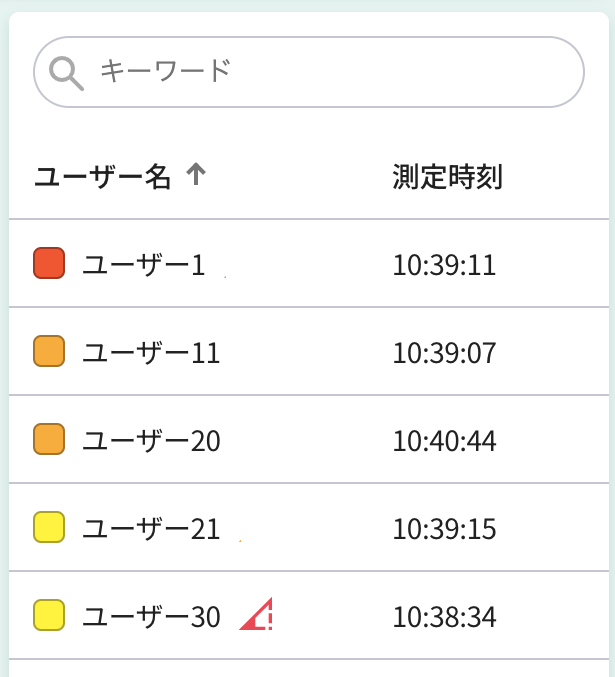
Highlight
When you click on a user, the shape on the map changes to highlight. When highlighting is set, the map automatically switches to the floor where the highlighted user is located.

Area List
A list of [Number of People] [Density] staying in each area of each floor is displayed. Density can be displayed by setting the area when creating the area. Areas with a high number of people relative to the area size have a caution mark next to the density.
- 100%~: Red
- 70%~99%: Yellow
- ~70%: No display
- No area setting: -
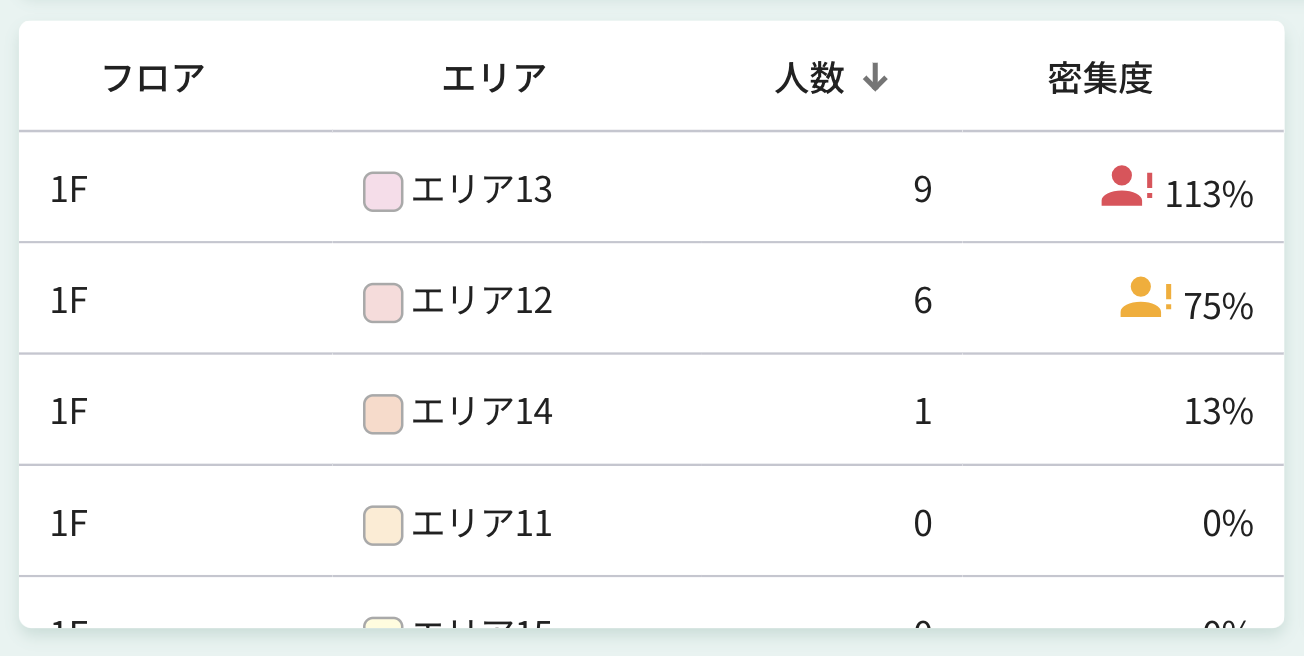
((Area occupied by one person (circle with a radius of 1m) _ Number of users) / Area size) _ 100 = Density
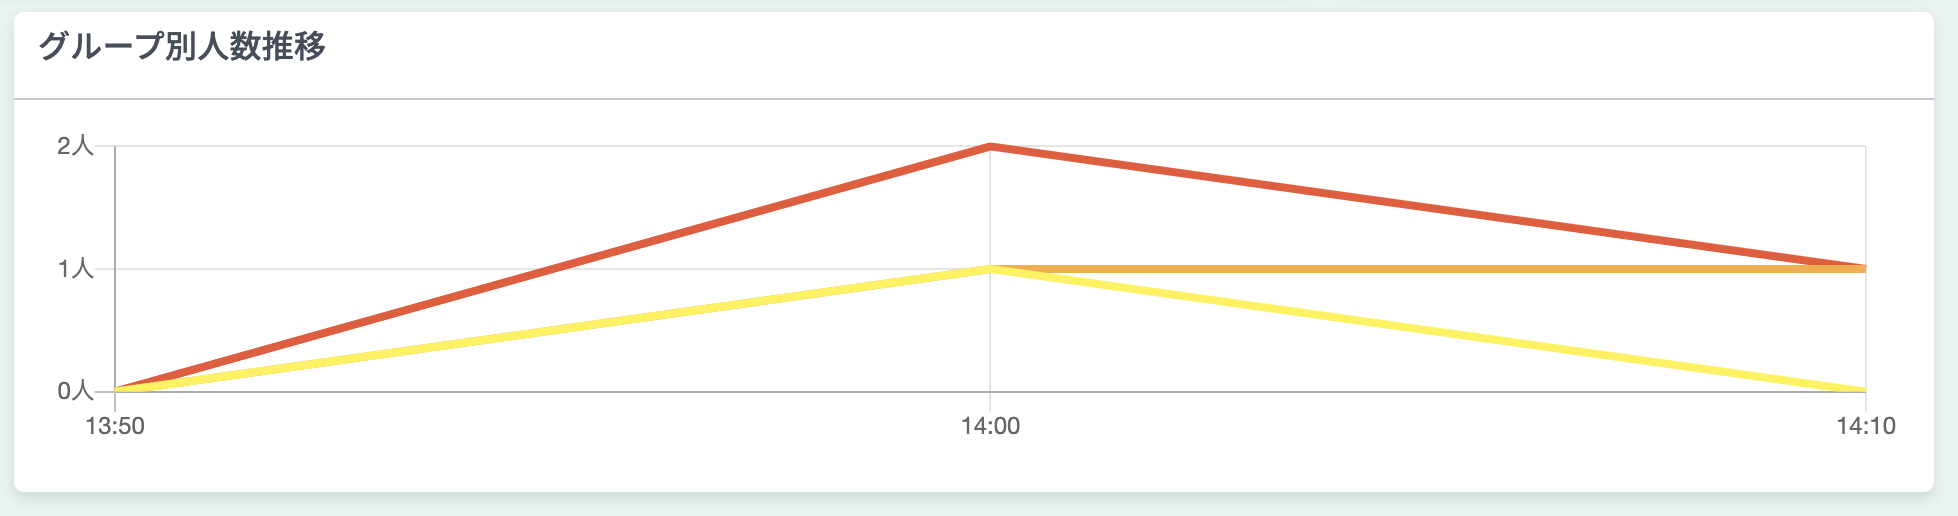
Group Transition by Number of People
The number of users in each group staying in the [Measurement Area] is displayed in a graph. The graph is updated every 10 minutes.